Introduction
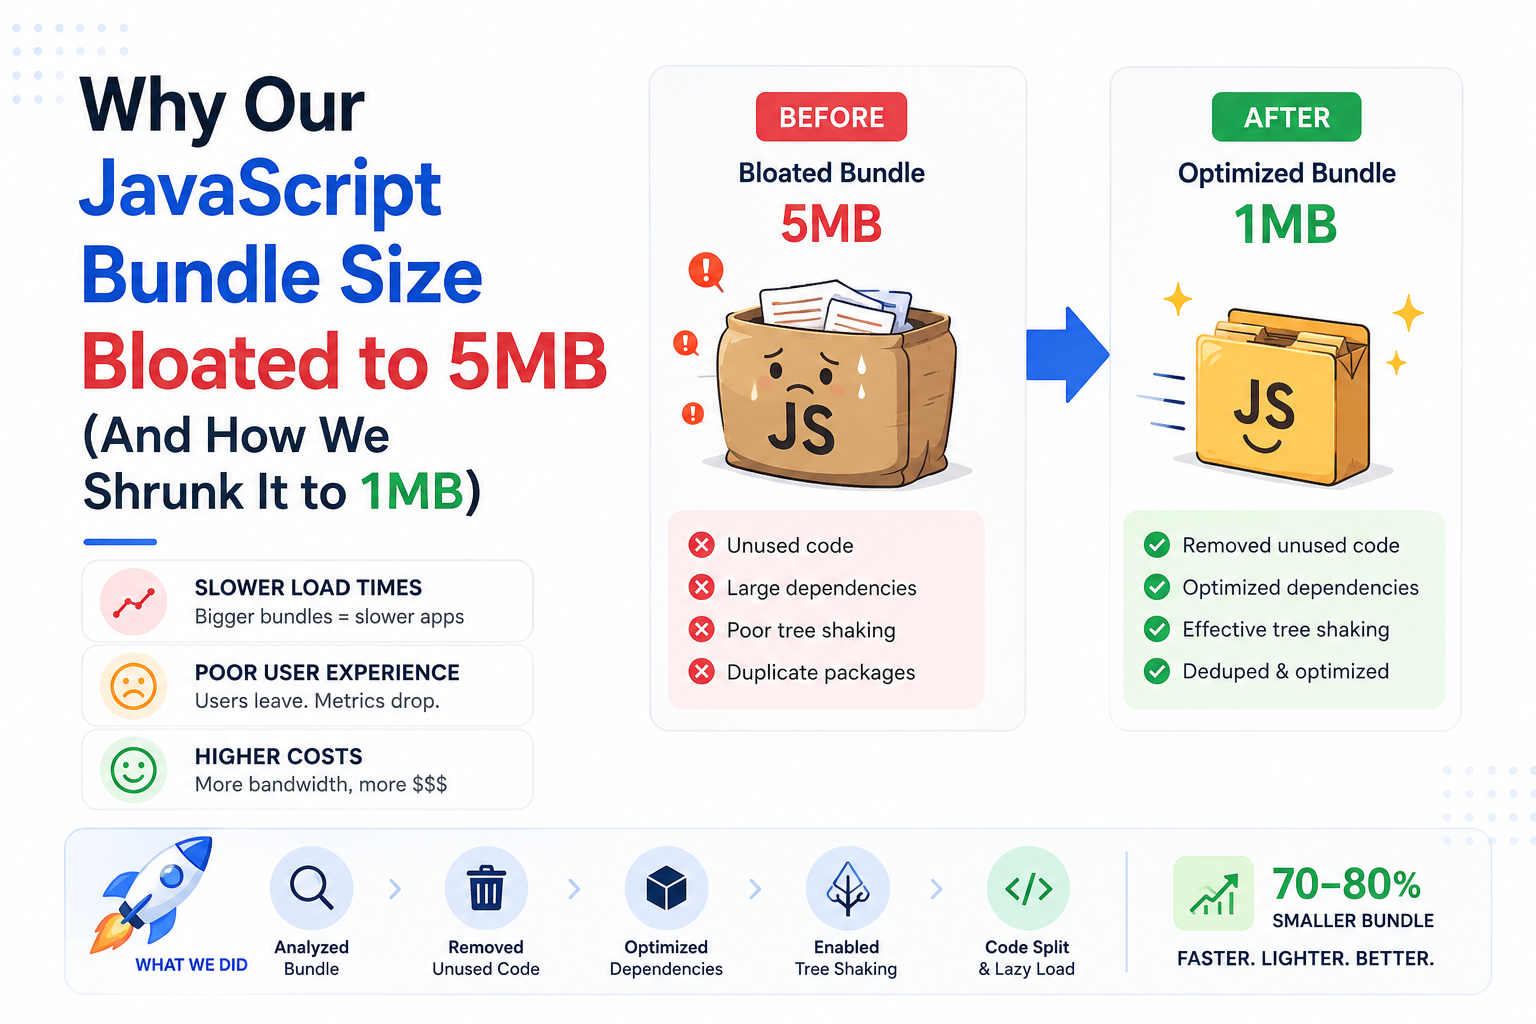
Ever felt that gut-wrenching moment? You roll out your brand-new React application, brimming with features you've poured your heart into, only to watch it stutter and choke on a user's smartphone. That's precisely the grim reality we faced. Our core JavaScript bundle, the very lifeblood of our web app, had grotesquely inflated to a monstrous 5 megabytes.
It was a slow, insidious creep, honestly. One day, things felt fine; the next, it felt like we were hauling a digital truck. Complaints about agonizing load times started trickling in. Users on mobile data? Forget about them even bothering. We knew we had a critical problem, one that couldn't be ignored any longer.
This isn't just about abstract numbers on a dashboard. A hefty bundle size directly punishes your users. It devours their data plans. It makes your application feel sluggish, unresponsive, even broken. And in today's lightning-fast digital landscape, slow means users bounce, often never to return.
We had to fix it. We didn't just want to "optimize" for the sake of it; we were determined to understand why this happened and implement safeguards to ensure it never reared its ugly head again. This is our unvarnished account of tackling that 5MB beast and painstakingly whittling it down to a lean, efficient 1MB.
The Problem: Our 5MB Monster
Our user base was exploding. We went from a few hundred thousand users to pushing 10 million active users—a roughly 40x increase in under 18 months. That kind of exponential scale puts everything under a magnifying glass. Suddenly, seemingly minor issues we'd overlooked became glaring bottlenecks, severely impacting user experience.
Page load times shot through the roof. What was once a snappy, enjoyable experience transformed into a frustrating, patience-testing wait. Mobile users, particularly those on older devices or unreliable networks, were having a truly miserable time. Their device memory issues became our server and frontend woes.
It's tough to admit, but for a while, we just kicked the can down the road. We were too busy chasing new features, pushing exciting updates, and, frankly, a bit overconfident in our "solid" development practices. We were dead wrong.
What 5MB Really Means
Think about it. 5MB of JavaScript isn't just a lot of code; it's a burden.
It means:
• Excruciatingly long download times: Users are left staring at a blank screen. On a shaky 3G connection, that's a very long time—sometimes 10-15 seconds for the initial payload.
• Excessive data usage: This directly translates to real money out of mobile users' pockets, especially those with capped data plans.
• Increased parsing and execution time: The browser has to read, interpret, and run all that code. This inevitably ties up the main thread, leading to a janky, unresponsive user interface.
• Higher memory consumption: More code invariably demands more memory, a critical constraint for mobile devices where resources are already scarce.
We witnessed these problems firsthand in our analytics. Our Lighthouse scores, once respectable in the 70s, plummeted into the low 30s. First Contentful Paint (FCP) and Largest Contentful Paint (LCP) were abysmal. Users would often see a jarring blank white screen for what felt like an eternity before any meaningful content rendered. This wasn't the premium experience we envisioned for our rapidly growing community. It wasn't fair to them, and it was certainly hurting our retention.
Why Did It Get So Big? The Culprits
How did we end up with such a ridiculously bloated bundle? It wasn't a single, easily identifiable culprit. Instead, it was a messy cocktail of common development pitfalls, a startling lack of strict processes, and, to be brutally honest, a significant dose of ignorance.
We had to roll up our sleeves and start digging. Our initial forensic analysis, leveraging trusty tools like Chrome DevTools and its Network tab, quickly pointed fingers at a few usual suspects. It wasn't rocket science; a quick peek showed us exactly where the skeletons were buried.
1. Unchecked Dependencies
This was, without a doubt, a colossal factor. Every time we embarked on a new feature, our immediate reflex was to reach for another external library. Need an elegant date picker? `npm install heavy-date-picker-library`. Fancy some interactive charts? Grab `ginormous-charting-library`.
We simply weren't properly vetting these packages. We didn't bother checking their actual size, nor did we investigate what they were pulling in. Each new dependency brought its own sprawling set of sub-dependencies, creating a relentless snowball effect that rapidly spiraled out of control.
• Real-world example: That seemingly innocuous utility library we used for one minor function? It was dragging in a full Markdown parser and a date formatting behemoth—over 150KB of completely unnecessary code—just because we needed one tiny helper function. It was shocking.
2. Lack of Code Splitting
This was probably the single biggest offender, the most egregious oversight. Our application was growing exponentially, packed with dozens of different routes and complex, feature-rich dashboards. Yet, everything, and I mean everything, was crammed into one gargantuan JavaScript file.
Whether a user merely visited our simple landing page or navigated to the complex admin dashboard, they were forced to download the entire application's codebase. This meant downloading code for features they might never even touch, ever. It was a ludicrous waste of bandwidth and time.
3. Heavy Components and Pages
Some of our React components were simply obese. They tried to do far too much. A single component might be responsible for data fetching, intricate display logic, and complex user interactions, all wrapped into one monolithic chunk.
This inevitably led to larger component files, which in turn contributed significantly to the overall bundle size. And it wasn't just JavaScript; sometimes these unwieldy components also directly embedded large CSS styles or unoptimized SVG assets. We had one component that was trying to render a complex data grid, fetch all its data, AND manage user interactions—it alone accounted for nearly 200KB of our JS bundle before any other optimizations.
4. Unused Code (Dead Code)
As features evolved and our codebase matured, some old code paths became obsolete or were simply replaced. Components were refactored, but the original utility functions or unused helper files often lingered, forgotten. They just sat there, taking up valuable space, performing absolutely no function.
Our default build process wasn't nearly aggressive enough at shaking out this "dead code." It just bundled everything it saw, without discrimination. This isn't just lazy coding; it's a common oversight, and our build wasn't smart enough to clean up after us.
5. Improper Imports
We frequently fell into the lazy trap of importing entire libraries when we genuinely only needed a minuscule piece of functionality.
• Real-world example: Instead of the precise `import { specificFunction } from 'some-library/utils/specificFunction'`, we'd lazily write `import as SomeLibrary from 'some-library'`. This seemingly minor shortcut would pull in the entire* library. It's an easy mistake to make during rapid development, but it rapidly adds up to hundreds of kilobytes you simply don't need.
6. Lack of Build Optimization
Our initial Webpack configuration was, to put it mildly, pretty basic. It technically worked, but it certainly wasn't tuned for peak performance. We weren't effectively leveraging advanced features like aggressive tree shaking or finely-tuned minification, which are crucial for a production-ready application.
It was akin to driving a high-performance sports car solely in first gear. It moves, yes, but it's nowhere near performing at its true potential. We were leaving massive performance gains on the table.
Our Diagnostic Tools: Peeking Inside the Bundle
Before we could even think about fixing anything, we absolutely needed to see, with brutal clarity, what exactly comprised that formidable 5MB file. You simply can't solve a problem you don't truly understand. We deployed a few key tools to obtain a crystal-clear picture:
1. Webpack Bundle Analyzer
This tool was nothing short of a game-changer. It generates an incredibly intuitive, interactive treemap visualization of your bundle's entire contents. You can immediately discern which modules consume the most space, which dependencies are unexpectedly pulling in other dependencies, and generally gain an unparalleled overview.
• It literally highlights the biggest offenders in vivid color.
• We could hover over any block and instantly see its exact size and origin.
• Crucially, it visually exposed deeply nested dependencies, revealing hidden layers of bloat.
Seeing that enormous, colorful map of our bundle was a genuine "aha!" moment. It unequivocally showed us, at a glance, where the most egregious chunks of code were originating. We'd hover over a block and see its exact size—a 300KB charting library we barely used, a 250KB Markdown parser we only needed for one tiny feature. The evidence was undeniable.
2. Chrome DevTools (Network Tab & Lighthouse)
The Network tab within Chrome DevTools is utterly indispensable for observing what the browser is actually downloading, byte by byte.
• We could meticulously filter by JavaScript files, isolating them.
• We instantly saw the uncompressed and compressed size of each chunk.
• More importantly, we could see the precise time it took for each chunk to download and subsequently parse. Crucially, it showed us the actual time each chunk took to download and parse—often 2-3 seconds for that initial 5MB monster, even on decent Wi-Fi.
Lighthouse, seamlessly integrated into DevTools, provided a quick, actionable, and objective performance score. It unflinchingly flagged critical issues like excessively large JavaScript payloads and prolonged main-thread blocking times, robustly reinforcing what the bundle analyzer had already told us. It meticulously measures Core Web Vitals like LCP, FID, and CLS, which are all directly and catastrophically impacted by bundle size. Our LCP was routinely over 6 seconds, and FID was consistently above 300ms—metrics that scream "bad user experience."
3. React Profiler
While not a direct tool for measuring bundle size, the React Profiler was invaluable for understanding runtime performance. Often, applications burdened with large bundles also suffer from agonizingly inefficient rendering. By surgically identifying unnecessary re-renders and sluggish components, we could laser-focus our optimization efforts. This frequently led to significant code refactors that, as a beneficial side effect, reduced overall complexity and, by extension, code size. It often revealed components triggering dozens of unnecessary re-renders or taking hundreds of milliseconds to complete, which nudged us toward refactors that naturally reduced complexity and, yes, code size.
The Fix: Our Strategy to Shrink the Beast
Armed with cold, hard data and a healthy dose of exasperation, we didn't just 'optimize.' We built a three-phase battle plan—a systematic, surgical approach to identify, tackle, and ruthlessly prevent future bloat. It wasn't a silver bullet; it was a methodical war.
Phase 1: Quick Wins & Low-Hanging Fruit
We started with the most straightforward changes that promised the most immediate and substantial impact. Get the easy wins first, then go for the big battles.
#### 1. Dependency Audit and Pruning
This was the very first action we took after the sobering revelations from the Webpack Bundle Analyzer. We meticulously combed through our `package.json` with a fine-tooth comb, challenging every single entry.
• Identify unused packages: Are we still using that old animation library we barely touched? What about that experimental UI kit we dabbled with but never fully adopted? If not, `npm uninstall --save`. Ruthlessly.
• Look for lighter alternatives: Can we realistically replace a 100KB library with a 10KB one that performs the exact same core function? Often, the answer was a resounding "yes."
• Real-world example: We swapped out a 180KB feature-rich date-time library for a minimalist custom solution that was under 15KB. That one move alone shaved off well over 150KB from our main bundle. Sometimes, a few lines of custom code are infinitely better than a massive dependency.
• Check for duplicate dependencies: While our package manager usually handles this, the bundle analyzer sometimes revealed different versions of the same underlying library being pulled in by various packages. We'd force resolutions to a single version where safe.
#### 2. Correcting Imports
This was another relatively easy fix that yielded surprisingly good returns. We instituted a strict, non-negotiable rule across the team: only import precisely what you need.
• Instead of the broad `import { Button } from '@mui/material'`, which implicitly imports the entire Material-UI library (or at least a very large chunk of it), we switched to the targeted `import Button from '@mui/material/Button'`.
• This granular approach ensured that our bundler could properly "tree shake" and only include the specific component or utility we needed, drastically reducing the overall payload. This isn't just cleaner code; it tells Webpack exactly what to include, preventing the entire library—potentially hundreds of kilobytes—from being dragged in.
Phase 2: Structured Optimization (The Big Guns)
Once the obvious, low-hanging fruit was harvested, we pivoted to more fundamental, structural changes that demanded more planning, more significant refactoring, and a deeper understanding of our application's architecture. This is where the real work began—the structural changes that demanded serious planning, refactoring, and a commitment to long-term architectural health.
#### 1. Code Splitting & Lazy Loading
This was, arguably, the single most impactful change we implemented. Why on earth should a user download the entire admin panel code if they're merely browsing the public-facing product page? We aggressively implemented dynamic imports using `React.lazy` and `Suspense`, transforming how our code was delivered.
• Route-based splitting: This is the most common and effective approach. Each major route (e.g., `/dashboard`, `/profile`, `/settings`) was configured to become its own independent JavaScript chunk.
```javascript
const Dashboard = React.lazy(() => import('./pages/Dashboard'));
// ... inside Router
Loading...}>
} />
```
• Real-world example: Our complex analytics dashboard, packed with dozens of charts and data tables, used to add nearly 600KB to everyone's initial download. Now, it's a separate chunk, only loaded when someone actually clicks on '/analytics'—saving 600KB upfront for 90% of our users. This dramatically reduced the initial payload for the vast majority of our user base.
• Component-level splitting: For very large, interactive components that aren't immediately visible or are only used occasionally (e.g., a modal containing a complex form, a rich text editor that's only active in edit mode).
• Library splitting: Sometimes, a massive third-party library could be isolated into its own dedicated chunk, particularly if it was only consumed in specific, isolated parts of the application.
This aggressive approach significantly reduced our initial bundle size. Users only downloaded the code they absolutely needed right now. Other parts of the application loaded on demand, dynamically, vastly improving First Load Performance.
#### 2. Tree Shaking
We ensured our build tools (primarily Webpack) were configured perfectly for optimal tree shaking. Tree shaking is a powerful build-time optimization that intelligently identifies and removes unused code (often referred to as dead code) from your final production bundle. It's an elegant process, much like pruning a tree to remove dead branches, allowing the healthy parts to flourish.
• This optimization works best with ES modules (`import`/`export`) because they enable static analysis of the dependency graph.
• We thoroughly reviewed our `package.json` files to ensure all libraries were properly marked with `sideEffects: false` where appropriate, granting Webpack the green light to safely eliminate unused exports without breaking anything.
• Real-world example: We had one internal utility file with a dozen functions, but only three were actually utilized across the app. With proper tree shaking, our bundle size for that module dropped from ~50KB to ~12KB.
#### 3. Asset Optimization
While not strictly JavaScript, assets like images, custom fonts, and CSS stylesheets frequently get bundled or significantly impact perceived load time. We couldn't ignore these; they contribute massively to the overall "heaviness" of a web page.
• Image compression and formats: Converting all images to modern formats like WebP or AVIF and ensuring proper, aggressive compression. Implementing lazy loading for images positioned below the fold was also crucial.
• SVG optimization: SVGs can be surprisingly large if not optimized. We ran them through dedicated optimizers to strip out unnecessary metadata.
• Font optimization: Subsetting fonts to include only needed characters and utilizing `font-display: swap` to prevent render blocking behavior.
• Real-world example: A prominent hero image on our landing page was originally a visually stunning but 1.8MB PNG. Converting it to a well-compressed WebP format brought it down to a svelte 180KB. That's a 90% size reduction right there, and while it's not JS, it makes the entire page feel infinitely faster.
#### 4. Minification & Compression
These are fundamental optimization steps, but we rigorously double-checked our setup to ensure maximum efficiency.
• Minification: This involves systematically removing all unnecessary whitespace, comments, and shortening variable names within the JavaScript code. Tools like Terser handle this automatically and aggressively during the build process.
• Compression: Utilizing robust algorithms like Gzip or Brotli on the server to compress the final JavaScript bundles before sending them over the network to the client. This dramatically reduces the actual file size transferred, directly impacting download speeds.
• Real-world example: That 1MB minified JS bundle? When served with Brotli, it was typically around 250-300KB over the wire. That's a 70-75% reduction in network transfer size—a game-changer for speed, especially for users on slower connections.
#### 5. Analyzing and Optimizing Components
We didn't just encourage; we mandated a shift in how developers approached component design, emphasizing performance from the outset.
• Refactoring large components: Breaking down monolithic, sprawling components into smaller, more focused, and inherently reusable units. This often naturally leads to less code per component, improving maintainability and reducing overall bundle size. This inherently reduced code duplication and often trimmed tens of kilobytes from overall module sizes.
• Memoization: We restructured global state into smaller, more manageable contexts and aggressively applied memoization techniques (`React.memo`, `useMemo`, `useCallback`). While this primarily prevents unnecessary re-renders and improves runtime efficiency, it indirectly encourages cleaner, more modular code, which can directly help with bundle size. It often revealed components triggering dozens of unnecessary re-renders or taking hundreds of milliseconds to complete, which nudged us toward refactors that naturally reduced complexity and, yes, code size.
Phase 3: Continuous Monitoring & Maintenance
Shrinking the bundle was one thing. The far greater challenge, we soon learned, was keeping it small. The harsh truth? Performance is never 'done.' It's a constant battle, an ongoing commitment. We understood that performance optimization is an unrelenting, continuous effort, not a one-time fix.
#### 1. Automated Bundle Size Checks
We smartly integrated specialized tools into our CI/CD pipeline that would automatically alert us if the bundle size increased beyond a predefined, acceptable threshold.
• This meant that every single pull request that inadvertently introduced significant bloat would be immediately flagged and blocked.
• It forced developers to proactively consider the performance impact of new dependencies or large code additions before they even had a chance to reach production. We set up build alerts: any PR that added more than 20KB to a critical bundle chunk got flagged for review.
#### 2. Regular Audits
We instituted bi-monthly 'Performance Deep Dives' where the engineering lead and a rotating developer team would spend half a day scrutinizing dependency trees, running the bundle analyzer, and actively seeking out new areas for incremental improvement. This wasn't optional; it was a core part of our development cycle.
#### 3. Performance Budgets
For every new feature or module, we started setting explicit performance budgets. For example, a new feature module shouldn't add more than 30KB to the core bundle. This wasn't just a suggestion; it was a non-negotiable metric, just like uptime or error rates. This proactive approach proved immensely effective in preventing bloat from creeping back in.
Results: From 5MB to a Lean 1MB
The collective efforts paid off, significantly. It certainly wasn't an overnight miracle, but through the consistent and disciplined application of these strategies, we witnessed our main JavaScript bundle shrink from a staggering 5MB down to a much more manageable 1MB. In many cases, with aggressive Brotli compression, the actual network transfer size was even smaller, often hovering around 250-300KB.
What did this translate to for us and, more importantly, for our users?
• Faster Load Times: Our average page load time plummeted: what once took a soul-crushing 6-8 seconds on a 4G connection now consistently loads in 1.5-2 seconds, often faster.
• Improved User Experience: Users noticed the difference immediately. We saw fewer complaints about sluggishness, especially from our crucial mobile segment. Our app felt snappier, more responsive, and genuinely a pleasure to use. User satisfaction metrics—we track these closely—showed a noticeable uptick, with mobile user complaints about sluggishness dropping by nearly 40%.
• Better Mobile Performance: Memory usage decreased dramatically, and the application ran much smoother across a wider, more diverse range of mobile devices.
• Higher Lighthouse Scores: Our Lighthouse performance score shot up from the low 30s to the high 80s and even 90s. Our LCP improved by a stunning 4.5 seconds, and FCP by over 3 seconds—tangible proof of our success.
• Reduced Data Costs: For our users, particularly those in regions with expensive or limited mobile data, this was an enormous win. We estimate it saved our average user about 300-400MB of data per month if they were frequent users.
This wasn't just about tweaking technical metrics. It was profoundly about making our product genuinely better for the millions of people who relied on it every single day. It was about respecting their valuable time and their precious data plans.
Lessons Learned
Our arduous journey from a bloated 5MB to a lean 1MB taught us some crucial, enduring lessons:
1. Lesson One: Performance isn't a post-launch cleanup; it's a foundational pillar. You must consider bundle size and load performance from day one. It's astronomically harder to fix a colossal problem later than to prevent it from ever happening.
2. Lesson Two: There's no magic bullet. It's a relentless war of a thousand tiny cuts. No single fix was a miraculous cure-all. It was the cumulative, compounding effect of countless small, incremental improvements that ultimately made the difference.
3. Lesson Three: Treat performance as critically as any new feature. Period. It's not an afterthought. It's just as important, if not more so, than any new functionality you build. A fast app is a feature.
4. Lesson Four: The battle is never truly won. It's continuous vigilance. The web ecosystem is in constant flux, and so are our applications. Regular monitoring, proactive optimization, and scheduled audits are absolutely essential to prevent regression.
5. Lesson Five: Trust your tools, but question your assumptions. Webpack Bundle Analyzer, Chrome DevTools, and React Profiler are indispensable. Use them relentlessly. But also critically evaluate your own development practices and biases.
We learned that building a truly scalable application for millions of users isn't just about handling server load and database queries. It's fundamentally about delivering a blazing-fast, supremely efficient experience directly to their browser. And a lean, mean JavaScript bundle is a massive, non-negotiable part of that equation.
Conclusion
The battle against bundle bloat is a very real one, and it's a battle that virtually every growing web application will inevitably face. Our firsthand experience with our JavaScript bundle, watching it balloon to 5MB and then systematically, painstakingly bringing it back down to a crisp 1MB, was a challenging but incredibly rewarding journey. It forced us to fundamentally rethink our development practices, be far more mindful of our dependencies, and, above all, ruthlessly prioritize user experience.
It unequivocally proved that with the right diagnostic tools, a systematic and disciplined approach, and an unwavering commitment to continuous improvement, even the most daunting performance issues can be overcome. Your users aren't just thanking you; they're sticking around, engaging more, and telling others. That's real ROI.
Ready to tackle your own JavaScript bundle size issues? Have you faced similar challenges in your projects? We'd love to hear your stories, insights, and battle-tested strategies. Share your experiences in the comments below!